Finding the right content in census data can be daunting. Just give you an idea how complex the census data are, there are 1127 tables and 25070 columns of table contents in the 2012-2017 ACS 5-year summary file alone.
| dataset | number of tables | number of columns |
|---|---|---|
| 2010 decennial census summary file 1 | 333 | 8959 |
| 2012-2017 5-year ACS summary file | 1127 | 25070 |
| 2017 1-year ACS summary file | 1372 | 33593 |
The complexity does not stop here. But before proceeding to further overwhelm ourselves, let’s explain what those summary files are.
A summary file contains the summary statistics of various geographic areas and is the most comprehensive dataset of a census survey available to the public. To carry out a survey, the Census Bureau mails census questionnaires to each address and collects information from returned mails or by sending enumerators to the doorsteps of addresses if the mail is not returned. The information relating to the individual addresses, however, is not published. Instead, the Census Bureau publish summary statistics of geographic areas covering multiple individual addresses to protect privacy. So in addition to the tables, which are derived from answers to the questionnaires, the summary files also contains rich information about geographic areas.
The Census Bureau publishes one or more summary file for each survey. The 2010 decennial census has two summary files, of which the summary file 1 is the most complete. Each year the Census Bureau publishes one summary file for ACS 1-year estimate since 2005 and one for ACS 5-year estimate since 2009. Along with each summary file, the Census Bureau also publishes a technical documentation, giving instructions on how to use the summary file.
We will look into the key elements of a summary file with totalcensus package. The names used in this package are based on the technical documentation of summary files. You can check this techincal documentation of 2010 census summary file 1 to get an idea. The package has several build-in datasets and functions to help navigate through the summary files.
install.packages("totalcensus")
library(totalcensus)
Tables and table contents
We use search_tablecontents() function to find table contents (called a variables in census API). You can specify year and keywords for the search, but the best way is to use it in RStudio without specifying year and keywords. For example, to search a table content in 2010 decennial census, simply run
search_tablecontents("dec")

# the search results can be assigned to a variable
# result <- search_tablecontents("dec")
where “dec” is for decennial census. All table contents will show up in the View() window in RStudio. We can then use filer to search for what we want. Let’s say we want to find table contents related to prisons in the 2010 decennial census, we use the filter to set the year and search for keyword prison (and jail). The results look like the figure as shown below. Actually the data has been used to map prisons in the US.

One more example. We have heard that Census Bureau asked for internet use in recent ACS surveys. Let’s find out what information were collected in a 5-year ACS summary file.
search_tablecontents("acs5")
Summary levels and geographic areas
Some of the geographic areas are obvious by the names, such as “state”, “county” and “school district”. Some are not well known to the public, for example:
census block: Census block is the smallest geographic area used in summary files. It has man-made or natural boundaries such as road and river. In urban area a census block is mostly equivalent to a street block. Summary statistics of census blocks are only available in the summary files of decennial census.
census block group: Well, it is a group of census blocks, typically have a couple thousand people. ACS 5-year estimate have summary statistics down to the block group level.
census tract: A census tract is roughly equivalent to a neighborhood, having one or more block groups, with typical population in the range of 2500 to 8000.
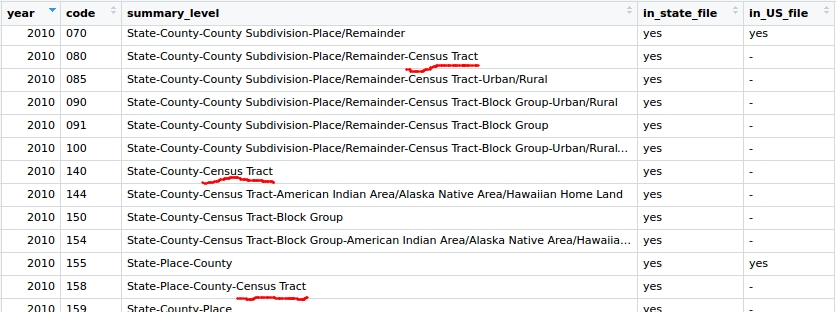
A Census tract or block group is entirely within the boundary of a county, but not necessarily wholly within the boundary of a town or a city. This brings up the concept of summary level (called geography in census API). Let’s pull out some data to see what the summary levels look like.
search_summarylevels("dec") 
Summary level refers to a nested structure of geographic areas from larger to small. For example, summary level with code 140 is from state -> county -> census tract. As we know that census tract is entirely within a county, the summary statistic of summary level 140 is about the entire tract. On the other hand the summary level 158 is from state -> place -> county -> census tract. As a county may not wholly within a place such as a city, the census tract in this summary level may be only the part of the tract within the place.
Geographic headers and geographic areas
Within the summary file dataset, there is a particular file called geographic header record file, which provides data of the attributes of geographic areas. It provides FIPS code of, for example, state and county that associated with the geographic area, or gives the coordinates, names, and land areas etc. A geographic header is also called a variable in census API. To find out more geographic headers, run code like
search_geoheaders("acs1") The
The totalcensus packages has two functions to search for fips code and geographic areas. search_fips() lists fips and names of states, counties, cities, and towns. search_cbsa() have more detailed information of core based statistic areas. Try them out.